
Debug Infos Viewer parse the Microsoft debug information of a software and allows (if .pdb associated to the software exists)
- to quickly display functions information (Virtual Address, Relative Virtual Address,calling convention, parameters information...)
- to generate a WinApiOverride monitoring file for internal functions of modules (exe,dll,ocx) according to selected functions.
- to generate WinApiOverride user types files.
- to show functions generated asm code
- to find functions from their Virtual Address or Relative Virtual Address
 |
This software allows you to quickly find the source of exception without a debugger (if you have pdb files): When an exception occurs (in debug or release mode), 1) Get the exception address. 2) Open associated module (exe or dll) with Debug Info Viewer Notice: associated module is the module that contains the exception address (you can use dumper to see modules address space) 3) Do a search "By Virtual Address (VA)" with the exception address. The search result is the function throwing the error.
Notice: this tip doesn't apply to jitted softwares like .NET |
Toolbar
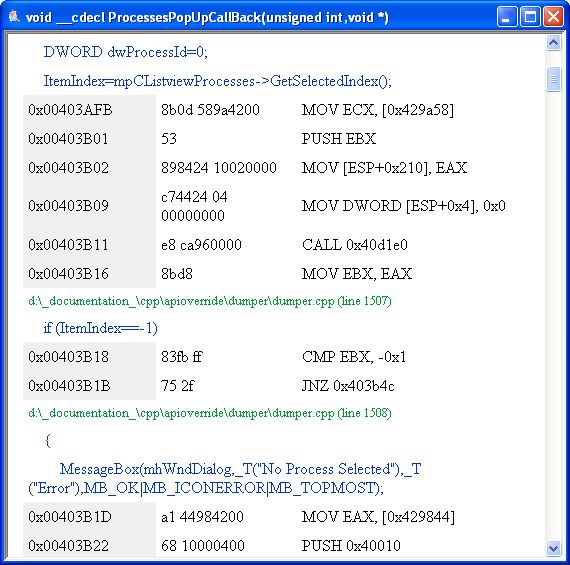
Show ASM
| The Show Function ASM button |  |
display asm code with associated source code. |
 |