- How to log structs or arrays ?
- How to build a monitoring file ?
- What is the difference between monitoring, overriding, pre and post hooks ?
- How to do parameter filtering ?
- Where can I find more monitoring files ?
- My monitoring file make my targeted software crash. What can I do ?
- How to change a parameter value ?
- Where is located the return value ?
- How to change a function return ?
- How to build an overriding dll ?
- How to find the address for an EXE_INTERNAL or DLL_INTERNAL monitoring ?
- How to get first functions bytes without a dissassembler
- Where is located the "this" pointer at function call ?
- Where are passed parameters
- What is caller address and how is it computed ?
- Why must I use internal dumper of WinAPIOverride to dump hooked processes ?
- What is VA, RVA and RAW ?
- Can I use multiple instance of WinAPIOverride32 ?
- Can I load Ansi monitoring files or overriding dll from the WinAPIOverride32 Unicode version ?
- Can I load Unicode monitoring files or overriding dll from the WinAPIOverride32 Ansi version ?
- I get an "A monitoring hook is already defined..." message (or Multiple hook definitions for the same function). What does it mean?
How to log structs or arrays ?
Use ":DataSize=" and ":PointedDataSize=" parameter options defined in Monitoring Files : Advanced Syntax
Where can I find more monitoring files ?
Monitoring files can be found at http://jacquelin.potier.free.fr/winapioverride32/monitoringfiles.php
All updates will be post at this address.
 |
You can post your created monitoring files to share them with other
WinAPIOverride users. To do it click on the next link. Please specify the name and the version of the dlls. Post a monitoring file |
My monitoring file make my targeted software crash. What can I do ?
First check all hooked functions with Monitoring File Builder (as explained here), and comment function definition for which a warning was reported.
It should solve your trouble in 99% of case.
If your application still crash with the modified monitoring file, you have to manually identify the hook responsible of the crash.
For this, inside the Option dialog, check the "Monitoring File Debug Mode" option : all modules filters will be by passed, and each api will be logged before and after it's call.
Once application has crash, look at Global stats dialog, and the api with an odd count is the responsible of the crash.
If this not working, you have to manual find it by doing multiple tests, by enabling functions one by one (or by group) and let the other disabled
Multiple hook definitions for the same function
When you get a strange message like

that means the function is already monitored by the specified file, so hook won't be install once again.
The ownership allows to specify when the hook will be removed : at the first file unload or when you unload the new file.
 |
If you don't take the ownership, the new function definition is not parsed, and new optional break or log conditions are not taken into account |
If you say that new file takes the ownership, you'll get another strange message :
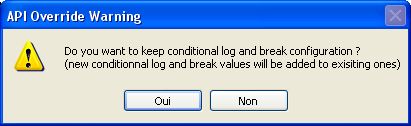
If you reply No, all Logging, breaking and failing conditions defined in the first loaded file are trashed,
and only the new options are used.
If you reply Yes, the old conditions are kept, and the new ones are added
Example :
First monitoring file :
lib.dll | Add(int x:LogValue=0x12,int y:BreakValue=14) | BreakBeforeCall
Second monitoring file
lib.dll | Add(int x:LogValue=0x15,int y)
If second monitoring files takes the hook and don't keep old configuration, it is equivalent to
lib.dll | Add(int x:LogValue=0x15,int y)
else, as previous conditions are kept, the result is simailar to the following definition
lib.dll | Add(int x:LogValue=0x12:LogValue=0x15,int y:BreakValue=14) | BreakBeforeCall
How to find the address for an EXE_INTERNAL or DLL_INTERNAL monitoring ?
Notice : the following doesn't apply to .NET application. For .Net applications, use Monitoring File Builder
If you still get the sources of the project,
New way since 5.0 (works only if your compiler generates pdb files like Visual Studio)
once you have built your target, use Debug Info Viewer and select functions you want to monitor. This software will generate the monitoring file for you, and it can display generated function asm code.
Warning : You have to regenerate the monitoring file each time you do a build (as function code start address may change due to build).
Old Way : put a break point on at begin of the function you want to hook.
Start your project with your IDE in the same configuration as you want to make monitoring file.
It's important as Debug and Release version don't generate the same code, and so the address of function will differ.
When your breakpoint is reached, use the IDE asm display. You get the address of the function.
Avoid to do a change your code adding a MessageBox or printf call to display your function address.
Adding or modifying code will probaly generate a different address, so the address you'll get by this way is absolutly no use.
Example with TargetSample in Release configuration
| 1) Put a break point in source code | 2) Go to asm view when breakpoint is reached |
 |
 |
|
Adding or modifying code will change the internal address. You have to check it each time you do a new build |
If you have LOST YOUR source code, you have to identify function address using an advanced disassember like IDA Since 6.2 version Monitoring File Builder can use generated IDA map file to create monitoring files
Get first functions bytes without a dissassembler
If you want to know the first bytes of one of your function, or an API function, you don't need a disassembler.
First put a break point at the place you do the call to the api or function (Make a small exe project if necessary).
Once done, run your code.
When the break point is reached, go to the asm view and do step by step until begin of function is reached.
In Visual studio assume that the "Show Code Bytes" options is checked (right click under asm view)
By the way for MessageBox function

Do "Step Over" until you reach the line "004457EB call dword ptr [__imp__MessageBoxA@16 (4A9B9Ch)]".
Next use the "Step Into"

Notice : when the software uses redirection table, the begin of function is not at the first "Step Into".
To be sure you are at the good location, for dll, you can check the address with the microsoft Depends software.
If dll is not rebased, function address = dll Prefered Base + Entry Point.
By the way for my version of User32.dll, and the MessageBoxA function using Depends we get

By displaying codes bytes, this allow us to see that for this version of dll, the first instruction bytes are 83 3D C4 D3 D6 77 00.
As the "cmp" asm instruction can be done anywhere, for this dll version we can use the option |FirstBytesCanExecuteAnywhere=7
Where is located the return value ? (32-Bit Compilers only)
The following table shows you where the return value is located in registers according to it's type
| Type (Length) | Returned via |
| 1 byte | AL or AX or EAX |
| 2 bytes | AX or EAX |
| 4 bytes | EAX |
| 8 bytes | EDX:EAX |
| Float | Stack or EAX |
| Double | Stack or EDX:EAX |
| Near pointer | EAX |
| More than 8 bytes | Implicit argument by reference |
Where is located the "this" pointer at function call ?
The following table shows you how the this pointer is passed according calling convention and compiler
| Compiler | |||||
| Calling convention | MS Visual C++ |
|
|||
|
ECX | EAX | |||
|
Trough the stack as the last argument | ||||
Where are passed parameters ?
From Wikipedia
| Architecture | Calling convention name | Operating system, compiler | Parameters in registers | Parameter order on stack | Stack cleanup by | Notes |
|---|---|---|---|---|---|---|
| 8086 | cdecl | RTL (C) | Caller | |||
| Pascal | LTR (Pascal) | Callee | ||||
| fastcall | Microsoft (non-member) | AX, DX, BX | LTR (Pascal) | Callee | Return pointer in BX. | |
| fastcall | Microsoft (member function) | AX, DX | LTR (Pascal) | Callee | “this” on stack low address. Return pointer in AX. | |
| fastcall | Borland compiler[11] | AX, DX, BX | LTR (Pascal) | Callee | “this” on stack low address. Return pointer on stack high address. | |
| Watcom compiler | AX, DX, BX, CX | RTL (C) | Callee | Return pointer in SI. | ||
| IA-32 | cdecl | RTL (C) | Caller | |||
| stdcall | RTL (C) | Callee | ||||
| GCC | RTL (C) | Hybrid | Stack aligned on 16 bytes boundary. | |||
| fastcall | Microsoft | ECX, EDX | RTL (C) | Callee | Return pointer on stack if not member function. | |
| fastcall | GCC | ECX, EDX | RTL (C) | Callee | ||
| fastcall | Borland/Embarcadero compiler | EAX, EDX, ECX | LTR (Pascal) | Callee | ||
| thiscall | Microsoft | ECX | RTL (C) | Callee | Default for member functions. | |
| Watcom compiler | EAX, EDX, EBX, ECX | RTL (C) | Callee | Return pointer in ESI. | ||
| x86-64 | Microsoft x64 calling convention[8] | Windows (Microsoft Visual C++, Intel C++ Compiler, Embarcadero compiler), UEFI | RCX/XMM0, RDX/XMM1, R8/XMM2, R9/XMM3 | RTL (C) | Caller | Stack aligned on 16 bytes. 32 bytes shadow space on stack. The specified 8 registers can only be used for parameters 1 through 4. |
| System V AMD64 ABI[10] | GNU/Linux, BSD, Mac OS X (GCC, Intel C++ Compiler) | RDI, RSI, RDX, RCX, R8, R9, XMM0–7 | RTL (C) | Caller | Stack aligned on 16 bytes boundary. Red zone below stack. |
What is caller address and how is it computed ?
When a function is called, return address is pushed on stack.
So WinApiOverride tries to get caller address from this return address.
It disassemble instuctions before return address to find a call.
If a call is found the caller address is supposed to be the call one.
If nothing is found, the return address is let unchanged (even if reported as caller address in logs).
This works in more than 95% of case but for the other case caller address can be fully wrong.
Take a look at the following pseudo asm code to see a case where such analysis can fail :
As you can see WinApioverride will detect the "call api" instruction as caller address even if call comes from "jmp api".
Why must I use internal dumper of WinAPIOverride to dump hooked processes ?
You HAVE TO use the WinAPIOverride dump dialog for hooked modules.
All other dumper will produce you a crashing code.
The reason is very easy :
To hook functions, we modify first bytes of functions. Only WinAPIOverride knows which bytes are modified.
As external dumpers don't know which functions are hooked and which are the originals bytes, they will save the modified bytes.
So you can't get a valid dump.
To create a dump, WinAPIOverride suspend process, removes the hooks and restore original bytes, do the dump,
restores the hooks, and then resume process.
But external dumper can dump all not hooked modules. So if you exactly know which modules are hooked or not, you can use them.
What is VA, RVA and RAW ?
VA (Virtual Address) : address at which instruction is when module is loaded (when module is not rebased). Address seen in your favorite disassembler
RVA (Relative Virtual Address) : address at which instruction is when module is loaded relative to module address begin. VA = RVA + module address
Raw : address of instruction in the binary file (when you open file with your favorite hex editor)
Can I use multiple instance of WinAPIOverride32 ?
Yes, but you can't target the same process. Each process can be hooked only once.
Only one instance of WinAPIOverride32 can use the "Attach to all new process" option.
Can I load Ansi monitoring files or Ansi overriding dll from the WinAPIOverride32 Unicode version ?
Yes, you don't need to do anything. WinAPIOverride support both Ansi and Unicode monitoring files and overriding dll
Can I load Unicode monitoring files or Unicode overriding dll from the WinAPIOverride32 Ansi version ?
Yes, since version 2.0 you don't need to do anything. WinAPIOverride support both Ansi and Unicode monitoring files and overriding dll